See what's in a debugger


You'll see a Script Debugger window if you run flawed code.
You can also open the debugger from a Composition Editor if you have a connection in your application. Select Debug from the Options menu. The Connection Trace Log displays, followed by the Debugger.
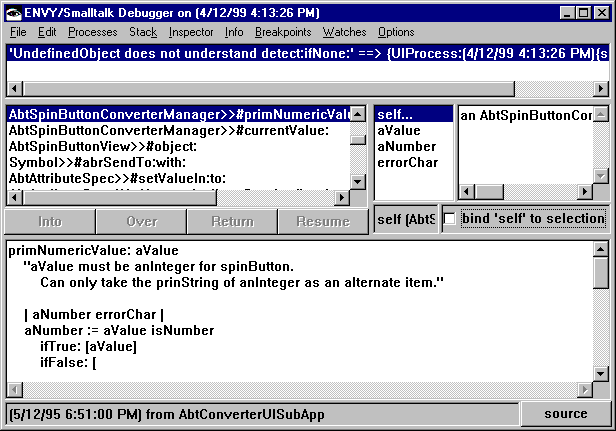
The debugger looks like the following:


Its five panes contain the following:
error message (upper left)
Shows a message that pinpoints the event that triggered the debugger.
message stack (middle left)
Lists the messages (scripts or methods) that were running when the debugger opened. Names are in the format: class>>#script. The most recent message is at the top, and the first message sent is at the bottom.
list of variables (upper middle)
After you select a message from the message stack, it names the object that received the selected message and any temporary variables of the selected message. It functions like an Inspector window.
variable values (upper right)
Shows the value of a selected variable at the time the error occurred. It also functions like an Inspector window.
script (method) description (bottom)
After you select a message from the message stack, it displays the script's source code. The expression sent is highlighted.
Last modified date: 08/12/2019