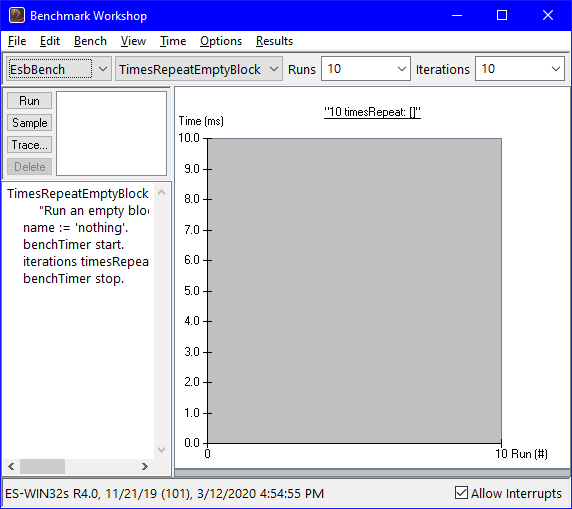
Overview of the Benchmark Workshop
You optimize code by iteratively building and discarding benchmarks and using the results to improve the code.
To open a Benchmark Workshop, select Open Benchmark Workshop from the Tools menu of the Transcript or evaluate the following expression:
EsbWorkshop new open
The Benchmark Workshop browser opens.


The browser consists of the following components:
•A tool bar
•A work area
•A status line
The tool bar
The tool bar has a row of combo boxes for configuring the bench. The combo boxes provide access to the following information:
•Bench class
•Bench method
•Number of runs
•Number of iterations per run
You can show and hide the tool bar by selecting Show Tool Bar from the Options menu.
The work area
The work area consists of the following components:
•Set of buttons for executing benchmarks
•Benchmark list to hold the raw data from each run
•Text pane to view and modify the bench code
•Line graph of the number of runs versus time results
•Bar graph showing a summary of the runs
The execution buttons and benchmark list
Executing the bench method using the Run, Sample, or Trace button gathers raw data for the bench method. The data is saved in the browser and is available through the items of the benchmark list. Benchmarks are given a descriptive name and are sorted by date and time. You can use the Delete button to discard unwanted runs.
The text pane
The text pane contains the source for the bench method.
The line graph
Each execution of a bench method is represented by a point on the line graph. The graph shows the number of runs versus the time for each run. Individual points may be selected and edited as described in Viewing the results. The summary statistics in the results bar graph are updated to display only the selected points. Points may be deleted to remove outlying values. The lines in the line graph are color-coded to match the results bar graph.
The results bar graph
The results bar graph shows a summary of the data in the line graph. The bar graph can be configured to show statistics about each run or comparison metrics between runs. When comparing individual runs, the baseline benchmark for the comparison is the first benchmark in the benchmark list.
The status line
The status line shows time and date information for all benchmarks in the browser. The status line can be shown and hidden by selecting Show Status Line from the Options menu.
Last modified date: 03/12/2020