Using the debugger
In VA Smalltalk scripts, as in any programming language, there are times when you need to start and stop program execution to verify that a script works properly, or to find and fix errors.
In the Debugger window, you can insert breakpoints in scripts, single-step through messages in a script, and inspect the contents of variables.
The debugger opens automatically when errors occur, or you can open the debugger at any point in your script by inserting a breakpoint instruction in the script. The breakpoint instruction is the halt message, which every object understands.
Starting the Debugger
If you have constructed some of the sample applications in this user'guide, add a breakpoint to one of your scripts.
Adding breakpoints using menu options
You can use the Break menu option available in many code browsers to add a breakpoint:
1. Open a browser such as a Script Editor on your code.
2. Position the cursor where you want to insert a breakpoint.
You cannot insert a breakpoint in a Doit method. Nor can you set a breakpoint on entry to a primitive method; however, breakpoints are supported in primitive fail code.
3. Select Break from the Edit or Breakpoints menu.
4. In the Configure Breakpoints window displayed, specify constraints on the breakpoint. One Shot specifies if the breakpoint should remove itself after the first time it is triggered. Stop in process defines the processes in which the breakpoint should fire. Stop at iteration defines how often many times a breakpoint can be hit in a process before the breakpoint fires. Stop when true defines a Smalltalk expression that causes a breakpoint to fire if it evaluates to true; the expression can use local and temporary variables.
For most breakpoints, you will likely want to take the defaults of false for one shot, <all> for the process and iteration constraints and true for the expression constraint.
5. Select OK.
The breakpoint is highlighted and a dot appears beside the browser's description pane.
To remove a breakpoint, change the method description and save the changes or select Configure Breakpoint from the Breakpoints menu. To clear all breakpoints, select Clear Method Breakpoints from the Breakpoints menu.
The system clears all breakpoints automatically before you package an image. This ensures that the breakpoints in the development image do not make their way into the packaged image.
For more information on breakpoints, refer to "Debugging code" in the Smalltalk User Guide.
Adding a halt
To add breakpoints to methods in your applications, it is best to use menu options. When you are evaluating code in a Workspace, however, you cannot add a breakpoint using a menu option. You must add the statement self halt to your code to create a breakpoint.
Place the statement before the code that you are inspecting. For example, as to the code in Examining objects, to inspect the printing of the ordered collection's size, you place self halt before the last line:
| aCollection |
aCollection := OrderedCollection new
add: 'Dog';
add: 'Cat'.
Transcript show: aCollection printString; cr.
self halt.
Transcript show: aCollection size printString; cr.
Or, you can send the halt message as a cascaded message:
#('Dog' 'Cat') halt; size.

You can set a conditional breakpoint by adding a self halt statement inside an ifTrue: or other conditional block.
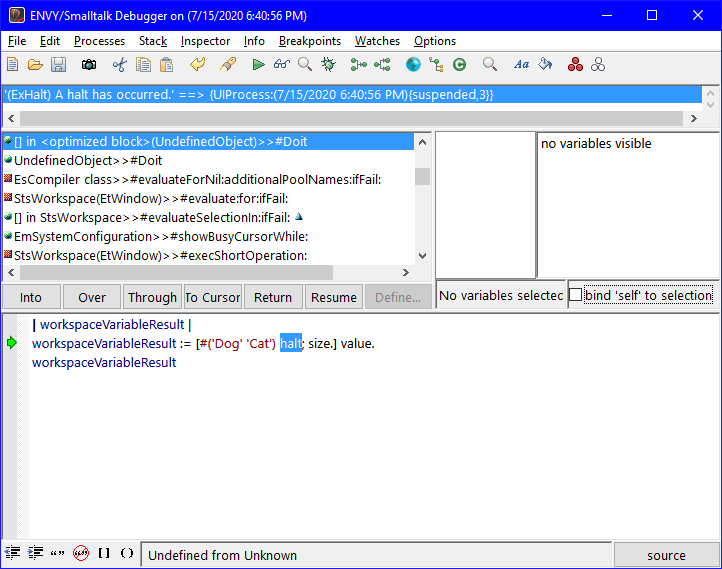
When you run the application or code containing self halt, a debugger resembling the following appears:


To remove the breakpoint, simply delete the self halt statement and your script will work as it did before.
Tracing message sends
The upper-left part of the debugger contains information about the process in which the error occurred and a list of the messages sent prior to the error. The most recent messages are at the top of the list.
As you click on each message in the list, the bottom text area displays the source code of the script that sent the message. You can move up and down through the list, browsing through the source code of each script.
Each time you click on a message in the list and display a script's source code, the line where the message was sent is highlighted.
You can make corrections in any script, select Save from the pop-up menu, and resume execution by selecting the Resume push button.
Inspecting variables
Notice that the upper-middle variable list displays the object that received each message and any temporary variables of the script. You can click on each variable in the list to see its value displayed in the right-hand text area. You can also double-click on the variable name to inspect it or change its contents.
Stepping through scripts
If you opened the debugger by adding a breakpoint, you can step through a script using the following push buttons:
Into
Displays the source of the script that is sent next. It takes you into other scripts and objects.
Over
Executes the script that is sent next without showing its source. It skips over the messages used to the next message in the script.
Return
Skips to the end of the current script, and stops only on a return (^) statement.
Resume
Continues execution, unless an unrecoverable error occurs.
After examining the code, you might have noticed the flaw in the code defining an ordered collection. The method yourself should be sent to the ordered collection after it is defined:
| aCollection |
aCollection := OrderedCollection new
add: 'Dog';
add: 'Cat';
yourself.
Transcript show: aCollection printString; cr.
Transcript show: aCollection size printString; cr.
Last modified date: 07/23/2020