Using the Connection Trace Log
For applications constructed from parts, you will occasionally want to run and stop your program to verify that a correct value is passed along a connection, or to verify that all needed connections exist and are in the correct order.
Starting connection debugging
You start connection debugging from the Composition Editor by selecting Debug from the Options menu. This starts a test instance of your visual part and displays the Connection Trace Log and a Smalltalk debugger.
This particular example is from the Road Race Application. The RoadRaceView has a connection between RoadRaceView Runners Collection to Result List. This is the connection being traced.
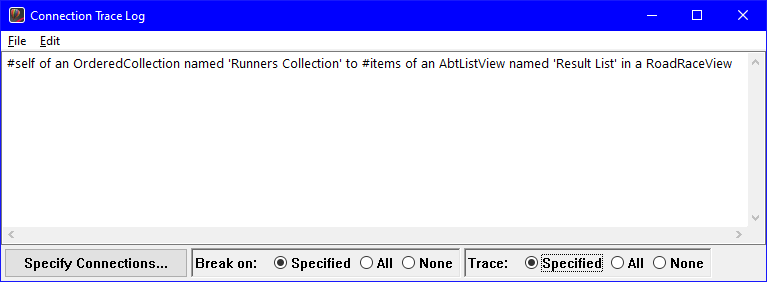
The Connection Trace Log looks like the following:


If your visual part has a connection that executes before the window actually opens, the Connection Trace Log stops on it and the test instance of your visual part does not appear initially.
By default, the Connection Trace Log starts with all connections in your visual part set as connection breakpoints and tracepoints, meaning that it suspends execution and displays information for every connection.
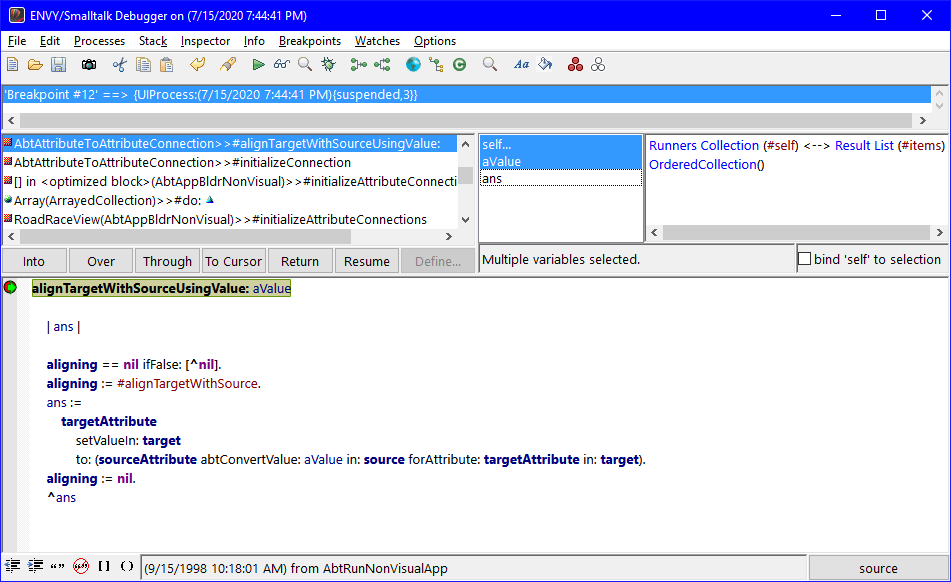
The debugger, upon opening, shows that VA Smalltalk placed a breakpoint, which is like a self halt, before the last connection described in the Connection Trace Log.


Using the debugger, you can walk through the code in your application and see whether connections are behaving as intended.

You can also start the Connection Trace Log and debugger by selecting one or more connections in your Composition Editor and selecting Debug Connections from the pop-up menu on the connection(s). This starts the Connection Trace Log with all connections in your visual part set as tracepoints but only the selected connections set as breakpoints.
Tracing connections
The top text area of the Connection Trace Log displays information about the connection tracepoints as they execute. The most recently executed connections are at the bottom. By default, a single line is displayed for each connection tracepoint, with the source part and attribute or event on the left and the target part and attribute or action on the right.
This same information is shown in the value (middle-right) pane of the debugger when it stops on a breakpoint.
Stepping through connections
You can step through connections the same way you step through Smalltalk code: use the Into, Over, Return, and Resume push buttons in the debugger.
To see what connections run and the order in which they run, press Resume repeatedly. The debugger stops on each breakpoint specified for the connections and the Connection Trace Log prints information on the connections run.
To keep the debugger open while it completes Resume operations, open the Options menu of the debugger and deselect Close After Resuming Last Process.
Inspecting values being passed along connections
When the debugger stops on a breakpoint, you can inspect the variables and see what values passed along the connection tracepoint.
To inspect a variable, select one from the variable pane (middle pane of the middle row) and select Inspect from the pane's pop-up menu.
To change a value, edit the value directly in the inspector or in the debugger's value (middle-right) pane and select Save from the value pane's pop-up menu. When you restart the Connection Trace Log, the parameter information is displayed and the connection executes, passing the value along it.
Last modified date: 07/15/2020