Steps for debugging connections


1. On the Composition Editor window, open the Connection Debugger by doing one of the following:
a. From the Options menu, select Debug.
b. From the pop-up menu for the connection, select Debug connections.
2. Select the breakpoint and tracepoint combination you want. For example, select Specified for both Break on and Trace.
3. Select Specify Connections. The Specified Trace/Break Connections Browser opens.
4. If the connection(s) on which you want to set breakpoints and tracepoints is (are) not shown in the browser, select Add Connection and complete the following steps.
If the connections are shown, remove any connections on which you do not want to set breakpoints or tracepoints and close the window. Skip the remaining steps.
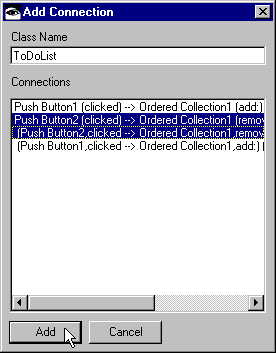
5. Top add one or more connections in the Add Connection window, type the name of the part whose connections you are examining in the Class Name field. All connections used by the part are shown in the Connections pane.
6. Select the connections on which you want to set the breakpoints and tracepoints.
7. Select Add.


8. If necessary, remove from the Specified Trace/Break Connections Browser any connections you are not interested in examining, and close the browser.
Refer to the Visual Programming User Guide for more information on debugging connections.
Last modified date: 07/25/2020